Viewing Output

The taskbar in Qt Creator can display following types of output:
- Issues
- Search Results
- Application Output
- Compile Output
- QML Debugger Console
- General Messages
- Version Control
- Test Results
- To-Do Entries
Output is available on the taskbar in all modes.

You can view output in the following ways:
- Select the output view on the taskbar.
- Select Alt (Cmd on macOS) and the number of the view on the taskbar.
- Select
 , and then select the view to open.
 - Select View > Output. The menu items also display the keyboard shortcuts that you can use.
To maximize an open output view, select the  (Maximize) button or press Alt+Shift+9.
To increase or decrease the output text size, select  (Zoom In) or
  (Zoom Out), or press Ctrl++ or Ctrl+-. Zooming is not supported in all output views.
To open the General Messages and Version Control views, select View > Output. To view To-Do Entries, enable the Todo plugin. For more information about the QML Debugger Console view, see Executing JavaScript Expressions.
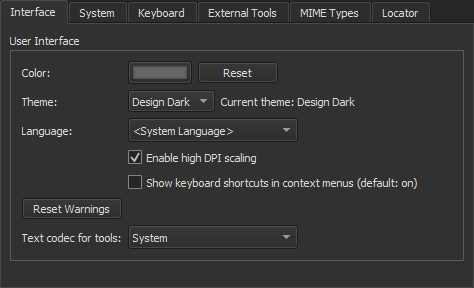
If the text in the output is not displayed correctly, Qt Creator might be using a different codec from the one used by the tools that generate the output. To specify the codec to use, select Edit > Preferences > Environment > Interface, and then select the codec in the Text codec for tools field.
Finding and Filtering Output
To search from output, press Ctrl+F when the view is active. Enter search criteria in the Find field. For more information, see Finding and Replacing.
Besides searching from the output, you can enter a string in the Filter field to filter it. To specify filtering options, select the  button. You can filter output by using regular expressions or case-sensitivity. Select Show Non-matching Lines to hide the lines that match the filter.
Finding and filtering are not supported in all output views.
Issues
Issues provides lists of following types of issues:
- Autotests - Errors and warnings encountered while running tests.
- Build System - Errors and warnings encountered during a build.
- Clang Code Model - Errors and warnings from the current editor.
- Compile - Selected output from the compiler. Open Compile Output for more detailed information.
- Debug Information - Lists debug information packages that might be missing.
- Debugger - Errors encountered while running the Valgrind code analysis tools.
- Debugger Runtime - Errors encountered when starting Qt Creator. For example, information about missing DLLs.
- Deployment - Errors encountered between building an application successfully and starting it on a device.
- My Tasks - Entries from a task list file (.tasks) generated by code scanning and analysis tools.
- Python - Runtime errors and exceptions of Python scripts.
- QML and QML Analysis - QML and JavaScript syntax errors.
The view filters out irrelevant output from the build tools and presents the issues in an organized way. To further filter the output by type, select ![]() (Filter Tree) and then select a filter.
(Filter Tree) and then select a filter.

Select one or several lines to apply context-menu actions to their contents. You can remove the selected lines or copy their contents to the clipboard. For single lines, you can search the Internet for a solution using the contents of the line as search criteria or open a version control annotation view of the line that causes the error message.
To navigate to the corresponding source code, click an issue or select Show in Editor in the context menu. The entry must contain the name of the file where the issue was found.
To view more information about an issue in Compile Output, select Show Output in the context menu.
To jump from one issue to the next or previous one, press F6 and Shift+F6.
By default, the Issues view is cleared on a new build. To keep the issues from the previous build rounds, deselect Edit > Preferences > Build & Run > General > Clear issues list on new build.
Search Results
In Search Results, you can search through projects, files on a file system or the currently open files:
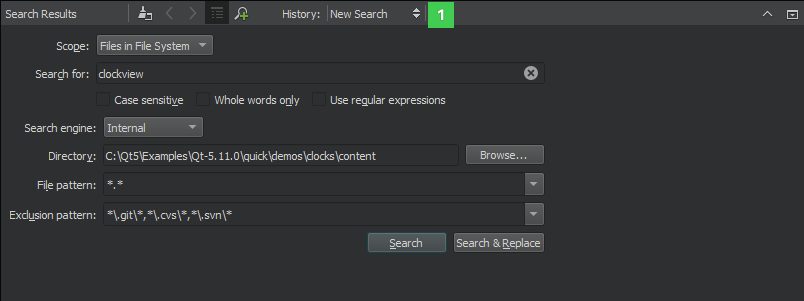
The search results are stored in the search history (1) from which you can select earlier searches.
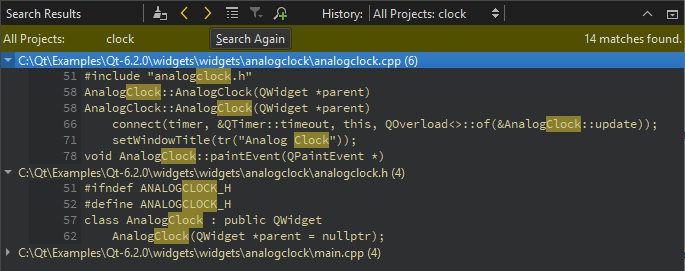
The figure below shows an example search result for all occurrences of the search string in the specified directory.
For more information about the different search options, see Finding and Replacing.
Application Output
Application Output displays the status of a program when it is executed, and the debug output.

If you specify command line arguments in the run settings that are passed to the application when running it, they are displayed as a part of the application output. For more information, see Specifying Run Settings for Desktop Device Types. Select toolbar buttons to run applications, to attach the debugger to the running application, and to stop running or debugging.
To specify settings for displaying application output, select Edit > Preferences > Build & Run > Application Output, or click the  (Open Settings Page) button. You can select whether to open Application Output on output when running or debugging applications, to clear old output on a new run, to word-wrap output, and to limit output to the specified number of lines.
Compile Output
Compile Output provides all output from the compiler. The Compile Output is a more detailed version of information displayed in Issues.

Double-click on a file name in an error message to open the file in the code editor.
Select the Cancel Build button to cancel the build.
To specify whether to open the Compile Output view on output when building applications, select Edit > Preferences > Build & Run > Compile Output, and then select the Open Compile Output when building check box. In the Limit output to field, you can specify the maximum amount of build output lines to display.
You can also open the preferences page by clicking  (Open Settings Page).
To copy the output to the clipboard, select Select All in the context menu, and then select Copy. Save the output as a file if you want to examine it later without having to build the project again. This is useful for large projects that take a long time to build.
Parsing Existing Compile Output
You can use Qt Creator's output parsers to parse output from builds done outside of Qt Creator or stored from previous build runs. By default, the parsers from the kit selected for the active project are used, but you can select another kit.
To parse compile output:
- Select Tools > Parse Build Output.
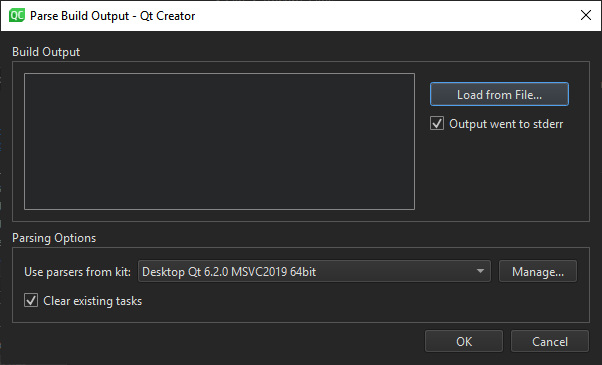
- Paste the build output in the Build Output field, or select Load from File to load it from a file.
- Deselect the Output went to stderr check box if the parser expects issues on
stdout. - In the Use parsers from kit field, select the kit to use for parsing the output. Select Manage to view and modify kit settings.
- The parser displays the parsed output in Issues. By default, the view is cleared before adding the new output. Deselect the Clear existing tasks check box to append the new output to the old output.
- Select OK to start parsing.
To-Do Entries
To-Do Entries lists the BUG, FIXME, NOTE, TODO, and WARNING keywords from the current file, from all project files, or from a subproject. Click the icons on the toolbar to show only the selected keywords.

To add keywords, select Edit > Preferences > To-Do > Add. Set an icon and a line background color for the keyword.
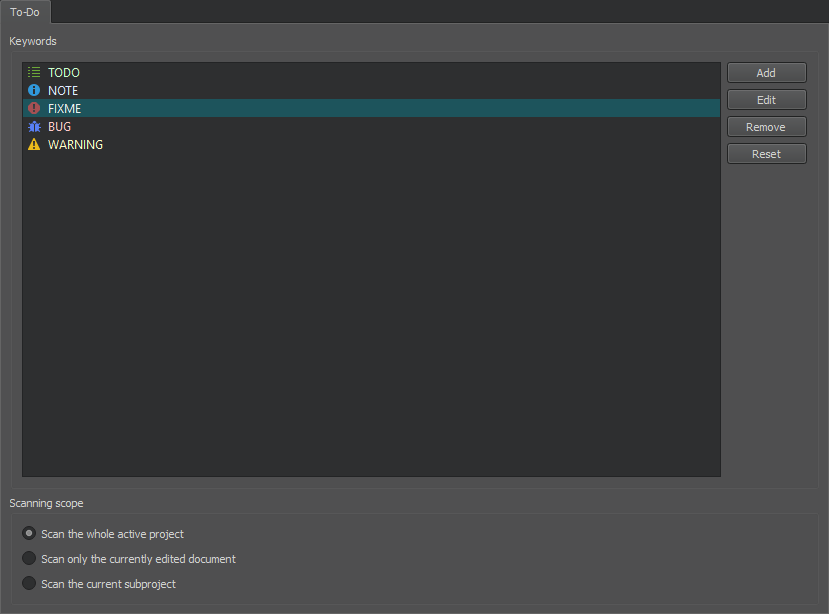
To change the icon and line background color of the selected keyword, select Edit.
To remove the selected keyword, select Remove.
To reset the list to predefined keywords, select Reset. All your changes will be permanently lost.
To determine whether the keywords in the whole project, in the current file, or in a subproject are displayed by default, select the appropriate option in the Scanning scope group.
To exclude files from scanning, select Project Settings > To-Do in the Projects mode.
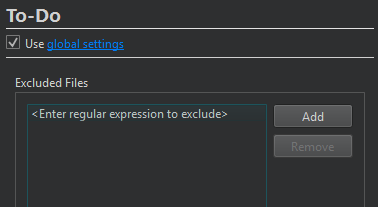
Select Add and double-click the placeholder text in Exclude Files to enter a regular expression that matches the path to files to exclude. Use a forward slash (/) as a separator in the path also on Windows.
Select the link in Use global settings to open global To-Do preferences.
The Todo plugin is disabled by default. To enable the plugin, select Help > About Plugins > Utilities > Todo. Then select Restart Now to restart Qt Creator and load the plugin.
In addition, you can open task list files generated by code scanning and analysis tools in Issues. For more information, see Showing Task List Files in Issues.